


A simple list of text comments can easily be overlooked by busy shoppers. ReviewX delivers rich visual representations — including interactive rating distribution graphs, customer recommendation bars, and multi-criteria breakdown charts — to instantly convey product satisfaction.
Thank you for reading this post, don't forget to subscribe!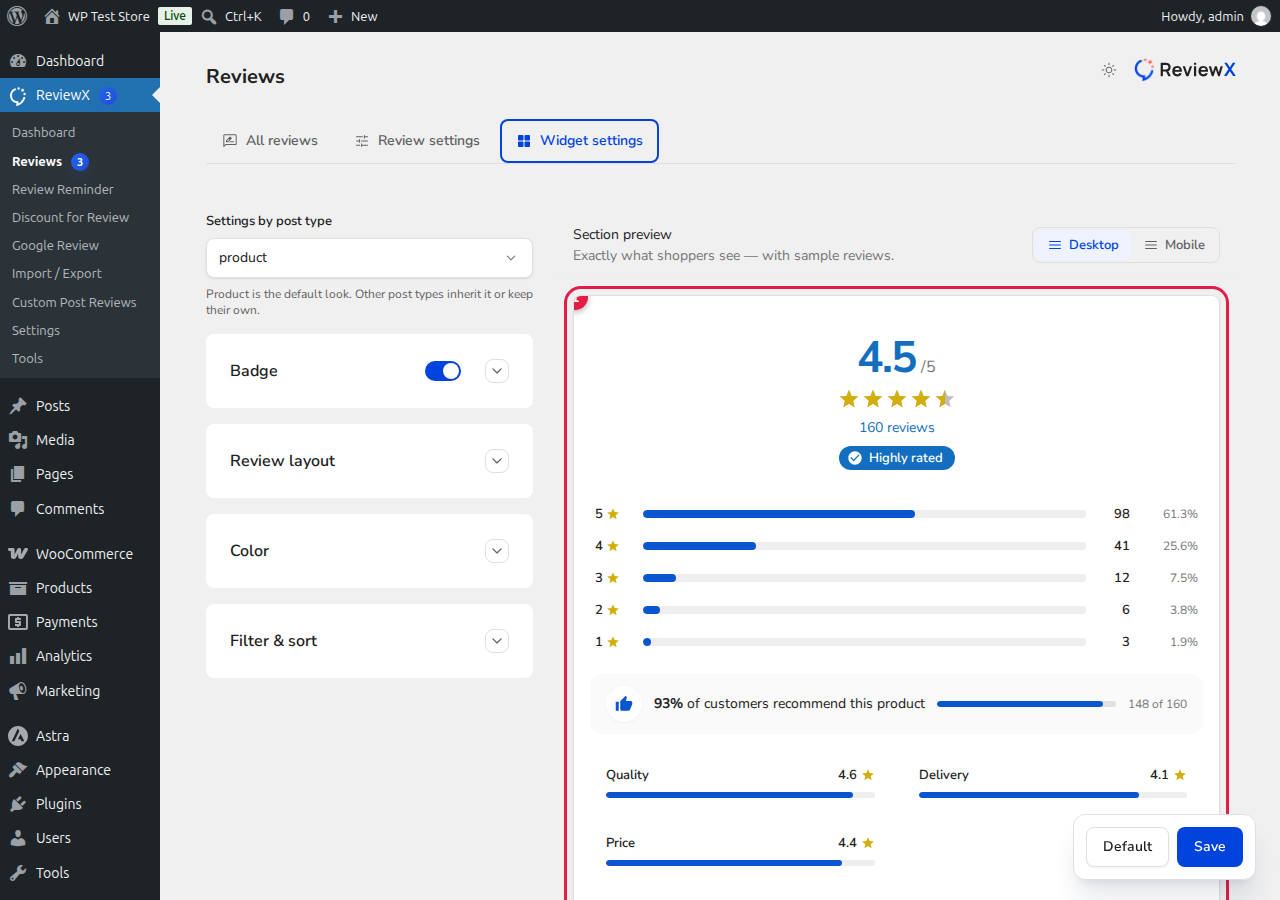
Key Visual Elements in ReviewX
When customers view a product page, the ReviewX widget displays several compelling visual proof components:
- Aggregate Score & Star Rating: A bold summary (e.g., 4.5 / 5 based on 160 reviews) anchored by a “Highly rated” badge for top-performing items.
- Interactive Rating Distribution Graph: Progress bars for each tier (5-star down to 1-star) show exact counts and percentages. Shoppers can click any star tier bar to instantly filter reviews matching that rating.
- Customer Recommendation Gauge: A prominent thumbs-up recommendation card showcasing social sentiment (e.g., 93% of customers recommend this product — 148 of 160).
- Multi-Criteria Performance Bars: Visual breakdown bars for specialized criteria (e.g., Quality: 4.6, Delivery: 4.1, Price: 4.4), helping shoppers evaluate specific product characteristics at a glance.
Configuring Visual Representations
- Navigate to ReviewX → Reviews → Widget settings.
- Under the Badge accordion, toggle “Show badge on review section” on or off.
- Under Review layout, choose between List, Grid, or Masonry to control card spacing and alignment.
- Check the Section preview panel to verify how your visual graphs appear on both desktop and mobile devices.
- Click Save to confirm your visual setup.


